Power BI has become a crucial tool in the realm of business intelligence, offering powerful data visualization and reporting capabilities. Whether you’re new to data analytics or looking to enhance your reporting skills, this step-by-step tutorial will guide you through the process of creating a complete End to End Power BI project, from data loading to dashboard creation. By the end of this tutorial, you will have a solid understanding of how to build insightful dashboards that can drive business decisions.
Understanding the Objectives, KPIs & Requirements for Your Power BI Project
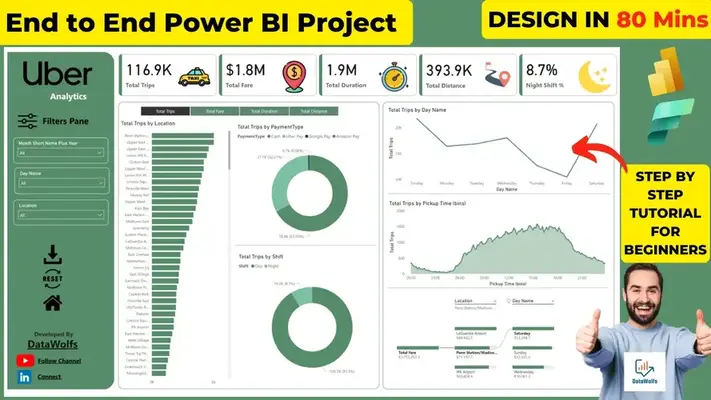
The primary objective of this Power BI project is to develop a comprehensive dashboard that provides insights into Uber/Ola Taxi ride data. We aim to track and analyze various metrics such as total trips, total fares, and trip distribution by location and time.
Key Performance Indicators (KPIs) for Power BI Report
- Total Trips Count: The number of trips within the selected timeframe.
- Total Fare: Total revenue generated from trips.
- Total Duration: Total time spent on all trips.
- Total Distance: Total distance covered in all trips.
- Night Trip Percentage: Percentage of trips occurring during nighttime.
Business Requirements
To meet the business objectives, the dashboard must address the following requirements:
- Geographic Insights: Visualize trip distribution by location.
- Time-based Analysis: Analyze trip patterns by day and time.
- Payment Method Breakdown: Display payment types used for trips.
- KPIs Display: Highlight key performance metrics in an easily accessible manner.
Dashboard Requirements
- Filters Panel: Allow users to filter data based on month, day, and location.
- Visualizations: Display total trips by location, day, and time with relevant charts and graphs.
- KPIs Display: Showcase the key metrics such as total trips, fare, duration, and distance prominently.
- Interactive Elements: Use slicers, filters, and dynamic visuals to make the dashboard interactive and user-friendly.
Steps to Create an End to End Power BI Project
Step 0: Understanding the Data
Before diving into the technical aspects of Power BI, it’s crucial to first understand the data you’re working with. This step involves examining the two data sources: the Trip Details Fact Table, which contains raw data about trips (e.g., trip duration, fare, payment type), and the Location Dimension Table, which provides location-based details (e.g., Location, Location ID).
Understanding the structure, data types, and relationships between these tables will help guide the transformation, modeling, and analysis phases. This foundation ensures that the insights derived from the dashboard are accurate and meaningful.
Step 1: Loading Data into Power BI Desktop
The first step in building this Power BI project involves loading the data into Power BI. We have two source tables:
- Trip Details Fact Table: Contains detailed information about each trip, such as trip ID, start and end time, distance, fare, and payment method.
- [payment_type] = 1 then “Cash” else if [payment_type] = 2 then “Uber Pay” else if [payment_type] = 3 then “Google Pay” else if [payment_type] = 4 then “Amazon Pay”
- Location Dimension Table: Provides details about various locations associated with the trips.
To load these tables:
- Open Power BI Desktop.
- Click on the “Home” tab and select “Get Data.”
- Choose your data source (e.g., Excel, SQL Server) and import the Trip Details Fact Table and Location Dimension Table.
Step 2: Data Cleaning and Transformation in Power Query
After loading the data, the next step is to clean and transform it using Power Query. Proper data preparation ensures that the data is accurate and ready for analysis.
Steps in Power Query:
- Changing Column Types: Ensure all columns have the correct data types (e.g., date, text, numeric).
- Creating Custom Columns: Generate new columns based on existing data (e.g., creating a column to categorize trips by time of day).
- Filtering Rows: Remove unnecessary data by filtering out rows that don’t meet certain criteria.
- Creating Columns Using Examples: Use the “Column from Examples” feature to create new columns by typing in sample data.
- Replacing Values: Standardize data by replacing values (e.g., converting different formats of payment methods into a single format).
Step 3: Creating the Data Model
A robust data model is crucial for effective data analysis. In this project, we create a date table and establish relationships between the fact and dimension tables.
Steps to Create Data Model:
- Create a Date Table: Generate a date table that spans the full range of dates in your data. This table is essential for time-based analysis.
DateTable =
ADDCOLUMNS (
    CALENDAR(DATE(2024,1,1), DATE(2024,12,31)),
    //CALENDARAUTO(),
    "Year", YEAR([Date]),
    "Quarter", "Q" & FORMAT(CEILING(MONTH([Date])/3, 1), "#"),
    "Quarter No", CEILING(MONTH([Date])/3, 1),
    "Month No", MONTH([Date]),
    "Month Name", FORMAT([Date], "MMMM"),
    "Month Short Name", FORMAT([Date], "MMM"),
    "Month Short Name Plus Year", FORMAT([Date], "MMM,yy"),
    "MonthSort", FORMAT([Date], "yyyyMM"),
    "DateSort", FORMAT([Date], "yyyyMMdd"),
    "Day Name", FORMAT([Date], "dddd"),
    "Details", FORMAT([Date], "dd-MMM-yyyy"),
    "WeekSort", FORMAT([Date], "w"),
    "Day Number", DAY ( [Date] )
)- Define Relationships: Connect the Trip Details Fact Table with the Date Table and the Location Dimension Table. Ensure that relationships are correctly set with one-to-many cardinality.
Step 4: Writing DAX Measures and Calculated Columns
With the data model in place, the next step is to define the DAX (Data Analysis Expressions) measures and calculated columns that will power the KPIs:
- DAX Measures: Create measures for Total Trips, Total Fare, Total Duration, and other KPIs. These measures will be dynamically calculated based on the filters applied.
Night Shift % =
VAR Nightcount = CALCULATE([Total Trips],'Trip Details'[Shift]= "Night")
RETURN
DIVIDE(Nightcount,[Total Trips],0)
Total Trips = COUNT('Trip Details'[Trip ID])Total Fare = SUM('Trip Details'[Fare])Total Duration = SUM('Trip Details'[Duration])Total Distance = SUM('Trip Details'[Distance])- Calculated Columns: Add columns that categorize or enrich the data, such as day/night trip classification or fare categories.
Shift =
//Code to Enter Shift Calculated Column using DAX
VAR _hr = HOUR('Trip Details'[Pickup Time])
return
SWITCH(
TRUE(),
    _hr>=6 && _hr<=21, "Day",
    _hr>21 && _hr<=23, "Night",
    _hr>=0 && _hr<6, "Night",
BLANK())
Step 5: Creating Report Visuals
With your data model and DAX measures ready, it’s time to create the visualizations that will bring your data to life.
- Visual Selection: Choose the appropriate visuals to represent each KPI and data point. Common visuals include bar charts, line charts, pie charts, and maps.
- Field Parameters: Use field parameters to make visuals dynamic and customizable by the user. This allows for a more interactive experience.
- Design Layout: Arrange the visuals in a logical and visually appealing layout. Ensure that the dashboard is easy to navigate and understand.
Visuals Used in the Dashboard:
- Bar Chart: To display the total trips count by location.
- Donut Charts: For visualizing the distribution of trips by payment type and time of day.
- Line Charts: To show trends over time, such as trips by day of the week and pickup times.
- KPI Visuals: To highlight key metrics like total trips, fares, duration, and distance.
Additionally, use field parameters to allow dynamic changes to the visuals based on user selection.
Step 6: Publishing the Report to Power BI Service
The final step is to publish your report so that it can be shared and accessed by others:
- Publish the Report: Click on Publish in Power BI Desktop and choose the appropriate workspace in Power BI Service.
- Configure Sharing Settings: Set permissions and share the report with relevant stakeholders.
Conclusion: Key Insights Derived from Dashboard
Creating a End To End Power BI dashboard from start to finish is a comprehensive process that transforms raw data into meaningful insights. The Uber trip analysis dashboard, as demonstrated in this tutorial, provides critical insights into trip distribution, revenue generation, and customer preferences. The dashboard allows stakeholders to identify peak trip times, top-performing locations, and the most popular payment methods, thereby enabling data-driven decision-making.
By following this end-to-end Power BI project tutorial, beginners can build their own dashboards, develop a deep understanding of data visualization, and leverage Power BI’s full capabilities for business analytics.
FAQs
What is use of Power BI in businesses?
Power BI is used for data visualization and business intelligence, allowing businesses to create interactive dashboards that help in decision-making.
Why is data modeling important in Power BI?
Data modeling enables the correct relationships between tables, which is crucial for accurate data analysis and reporting.
Can I automate data refresh in Power BI Service?
Yes, Power BI Service allows you to schedule automatic data refreshes, ensuring that your reports are always up to date.
What are DAX measures in Power BI?
DAX measures are calculations that are dynamically computed based on the data model and filters applied in the report.
How do I share Power BI reports with others?
Reports can be shared via Power BI Service by publishing them and setting the appropriate sharing permissions.
Download Files for End to End Power BI Project
We have provided links to download all resources to follow along with this Power BI End-to-End Power BI Project.